The Social Statistics Division, National Statistical Office Ministry of Statistics & Programme Implementation of the Government of India released Women and Men in India 2022, the 24th issue of a statistical compilation of gender-related indicators in India. As per the press note released to support the release of the report, “The report is a comprehensive and insightful document that provides data on a wide range of topics such as education, health, employment, and political participation, among others. It presents data disaggregated by gender, urban-rural divide, and geographical region, which helps us understand the disparities that exist between different groups of women and men.”
The report covers specific sections on population statistics, health statistics, education statistics, participation in the economy, participation in decision-making, and impediments in empowerment. It cites the reasons for the disparity in the participation in the economy on educational attainment, fertility rates and the age of marriage, economic growth/cyclical effects and urbanisation through global indicators, and social norms as well to an extent.
Lower participation for women along with average wages lower than men
The indicator that is used is the Labour Force Participation Rate (LFPR), which provides the percentage of all people of working age who are employed or are seeking work. However, it excludes individuals who are neither working nor looking for work like students, pensioners, housewives, etc. While the report acknowledges that there’s work done by housewives along with the care work which goes into the sustenance and growth of the economy but is invisibilised on an everyday basis, it’s not included in the report. The disparity in LFPR has been consistent (77.2 for males and 32.8 for females in 2021-22) over the years with higher precedence in urban areas than rural areas, for which the reasons aren’t explored within an understanding that situates the circumstances.
The aim of the report is to mark a shift towards an inclusive and sustainable development process, which requires increasing women’s labour force participation, removing barriers to entry and access, improving conditions at workplaces, tackling gender disparity, and ensuring women workers have protection from exploitation in the informal economy among other reasons. The section discusses “balancing the competing burdens of work and family responsibilities” which needs more clarification. The recommendations include incentive mechanisms, training, job reservations and a safe workplace environment.
Another indicator utilised is the Worker Population Ratio (WPR) [shown in Figure 4.11 below], which informs what proportion of the population actively contributes to the production of goods and services. While a little more than half the population actively contributes from both rural and urban areas, the participation of women is again very low. The Average Wage for women workers was also lower compared to men, and lower for women in urban areas compared to rural areas. The worrying trend of a decrease in the participation of women as they climb up the education ladder is still present.

In rural areas, major proportions of both males and females were self-employed and least were engaged in wage/salaried employment and while a higher number of women were self-employed, they were also higher in number as helpers in household enterprises.
Also Read: Repression of Civic Freedoms in India: Global Civil Society “Civicus” Asserts
As per statistics, agriculture is the source of employment in rural areas followed by construction, and in urban areas, manufacturing was the major source of employment. While more women occupied agriculture and other services, men occupied construction, trade, hotel & restaurant, transport etc. pointing towards the gendered nature of work.

A crucial economic indicator that was focussed upon is the Unemployment Rate, decoding the underutilisation of the labour force by reflecting upon the inability of an economy to generate work for people who wish to work. The female unemployment rate has been lower than males in rural areas and it’s the opposite in urban areas since more opportunities (agriculture and informal sector) are available in rural areas than in urban areas to women.
Women spend more time in unpaid activities: Addressing gender disparity and gender gap
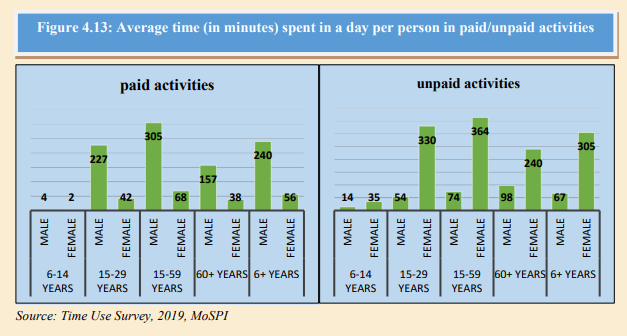
An interesting aspect of the report is the focus on Activity (paid, unpaid and residual other activities), with the conclusion, “Women spend more time on unpaid activities than men and men devote more time on self-care and self-development than women.” The unpaid activities are further disaggregated into SNA and non-SNA production, statistics show that females spend more time on non-SNA production activities by a wide margin (women spent 281 minutes of a single day in non-SNA activities while men spent only 38 minutes on average). Figure 4.13 details the average time (in minutes) spent in a day per person in paid/unpaid activities.
The aim of the report is to mark a shift towards an inclusive and sustainable development process, which requires increasing women’s labour force participation, removing barriers to entry and access, improving conditions at workplaces, tackling gender disparity, and ensuring women workers have protection from exploitation in the informal economy among other reasons.
Also Read: Gender-Based Violence Is A Global Pandemic: KEM Report
The section discusses “balancing the competing burdens of work and family responsibilities” which needs more clarification. The recommendations include incentive mechanisms, training, job reservations and a safe workplace environment.
Every number is a story in itself
As per testimonials from workers (both men and women) in urban and rural areas, the understanding of gender disparity and gender gap still remains intact in both these spaces. Women continue to find it difficult to get jobs in areas which are considered traditionally male. As per Rina, a domestic help who moved from a small village to an urban city in search of better opportunities, the wage difference between what she and her husband earn is quite stark. At the same time, the nature of the opportunities they get is also based on their gender, with no emphasis on their skills or education.
While the report is a primarily data-driven understanding of the gender statistics in India, it ends up using vague terms such as “socio-economic reasons” or “norms” to substantiate the number. The statistical approach works well enough to provide a wider look but every number tells a different story and the next step should be inclusive of qualitative research methodology which emphasises how to improve upon these numbers, starting from the grassroots level.
Within metropolitan cities, as per Richa, she also faces difficulty in getting access to jobs in a reputed corporation (especially in light of recent massive layoffs), especially in the tech sector where they are often paid less than their male counterparts and also suffer in promotions in terms of salary and towards leadership positions. She also pointed out how her male colleagues and friends are not aware of this disparity, and why it is important for them to also realise the impact one’s gender identity can have on their participation in the economy.
Also Read: IAMAI Report: Digital Gender Divide Lingers In India
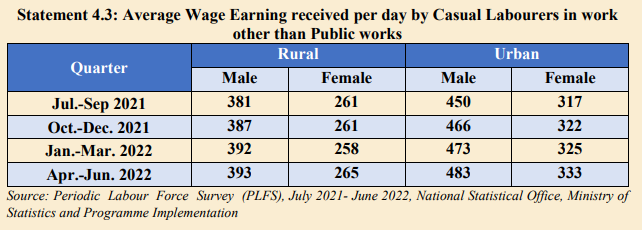
Since the report mentions that women casual labourers (working in other than public works) in rural areas have better participation in the workforce or better wages than women casual labourers in urban areas, it fails to take into consideration the kind of workplaces that exist in both these spaces (whether formal/informal) and the cost of living that vastly differs. The table in Figure 4.3 elucidates the average wage-earning received per day by casual labourers at work other than public works.
While the report is a primarily data-driven understanding of the gender statistics in India, it ends up using vague terms such as “socio-economic reasons” or “norms” to substantiate the number. The statistical approach works well enough to provide a wider look but every number tells a different story and the next step should be inclusive of qualitative research methodology which emphasises how to improve upon these numbers, starting from the grassroots level.
Glossary:
- Labor Force Participation Rate (LFPR) is defined as the percentage of persons in the labour force in the population.
- Unemployment Rate (UR) is defined as the percentage of persons unemployed among the persons in the labour force.
- The method of deriving time spent per participant and per person is expanded upon in detail in the report.
The report can be accessed here and the statistical annexe section deals with state-wise data on the indicators discussed in this article. For a deeper understanding of the ‘Wages for Housework’ and the existing disparity in how women and gender minorities get paid much less than men, one can watch the film ‘All Work And No Pay (BBC Open Door, Feb 1976)’ here.